File
This section illustrates roles and uses of file-related menu items.
New Report
The New Report icon leads you to create a new report file.
Click File -> New Report and you get the New Report Wizard dialog box, as shown in 1.2.1-1:
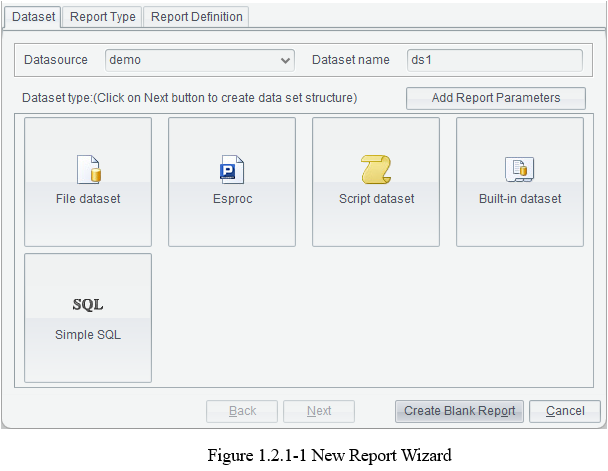
ReportLite offers four styles of reports – blank report, grid report, grouped report and crosstab report.
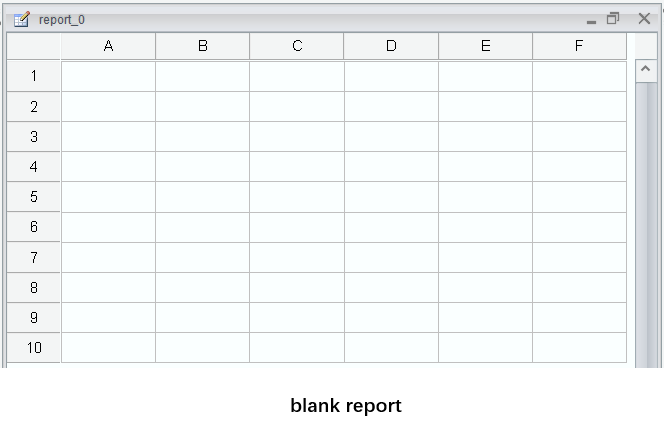
Ø Blank report
Click File
- > New Report and, on the New Report Wizard
dialog box shown in 1.2.1-1 click “Create Blank Report” button to generate a
blank report. You can also click “New Report” icon ![]() on the toolbar to generate one.
on the toolbar to generate one.
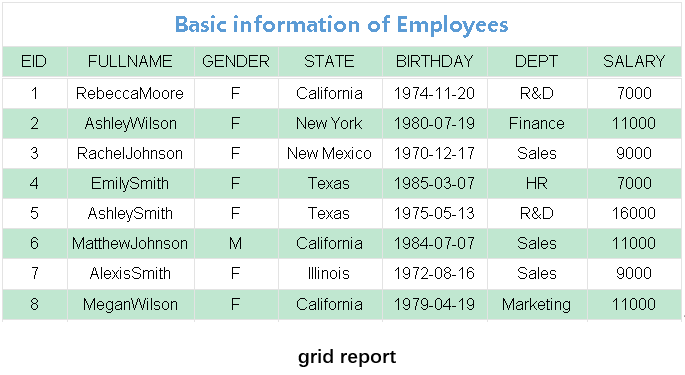
Ø Grid report
Step 1: Click File - > New Report.
Step 2: Select a target from the Datasource list, edit Dataset name – default name is “ds1”, and select one under “Dataset type”, such as Simple SQL (before creating a new report, connect to the data source through Tools -> Datasource and the data source name will appear under the Datasource edit box on New Report Wizard shown by figure 1.2.1-1).
Step 3: Click “Next” button to enter SQL Editor interface, as shown below:
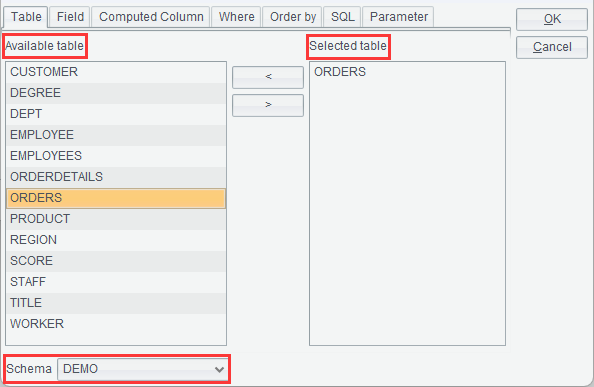
Step 4: First, select a schema from the “Schema” drop-down list on the bottom. Second, select table names from “Available table” box on the left side to the “Selected table” box on the right side. Third, select field names of each selected table to the “Selected Fields” on the right side on “Field” tab. Then, switch to a desired tab as needed, “Computed Column”, “Where”, “Order by” or “Parameter”, to edit. Then you can view and check the generated SQL statement on “SQL” tab. Now click “OK” button to pop up the following interface:
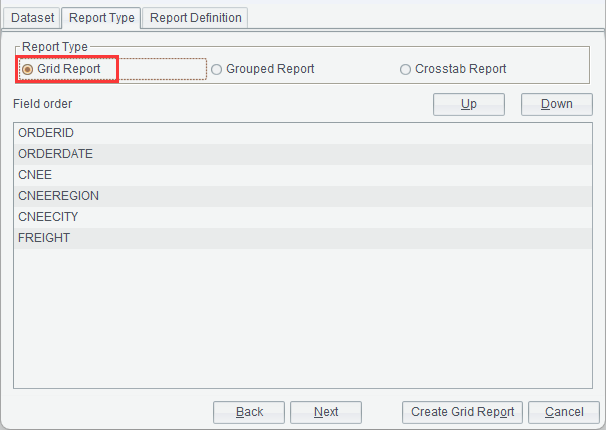
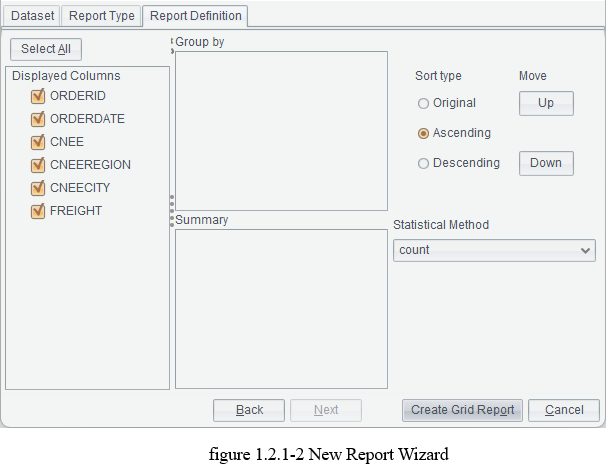
Step 5: Select “Grid Report” and click “Next” to get the following interface:
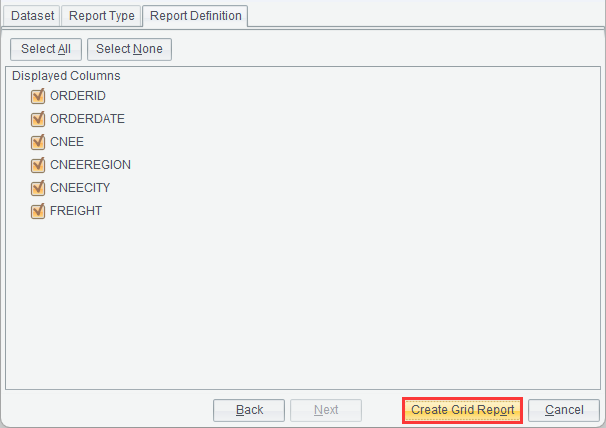
Step 6: All columns available to be displayed are listed under “Displayed Columns”. You select fields to be displayed in the report and click “Create Grid Report” button to enter report editor interface. Now a grid report is created. If you need to display all fields under “Displayed Columns” in the report, click “Select All” button. You can also directly click “Create Grid Report” button after selecting “Grid Report” in step 4.
Now you finish creating a grid report. If you need to create a grouped report through the wizard, select “Grouped Report” under “Report Type” and click “Next” button in step 4 to enter the following interface:
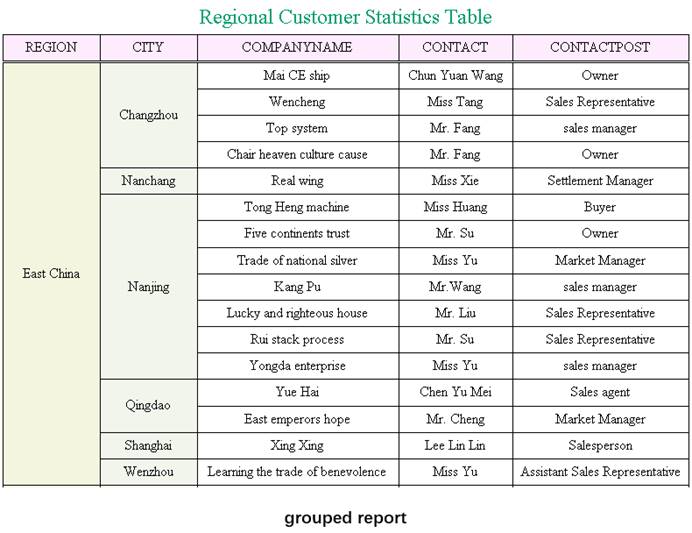
Ø Grouped report
On the New Report Wizard shown in figure 1.2.1-2, we define the field(s) by which the report is grouped.
First, drag the grouping field to Group by box. Same way for defining a multilevel grouped report, for which we can adjust the order of levels through Move up/down buttons.
Then, drag the target field to be summarized to Summary box and select a function in the drop-down list of “Statistical Method”.
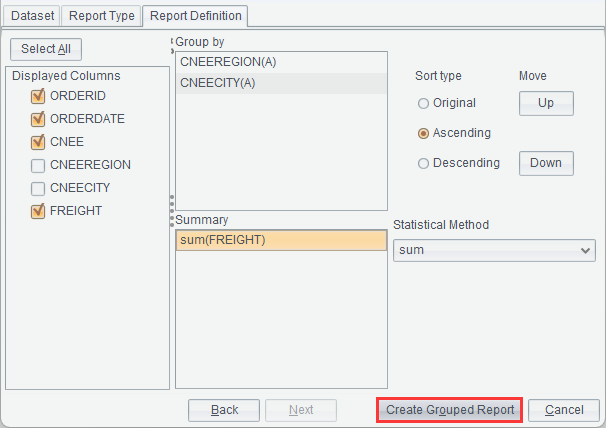
Last, click “Create Grouped Report” button to get into the grouped report editing interface, where report expressions are already automatically generated.
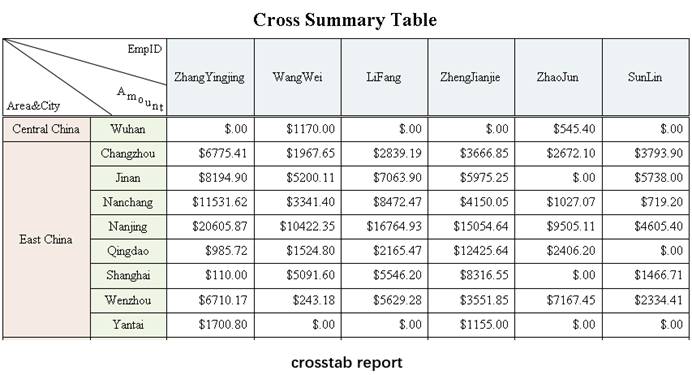
Ø Crosstab report
To create a crosstab report through wizard, select “Crosstab Report” in Step 4, click “Next” to get into the following New Report Wizard:
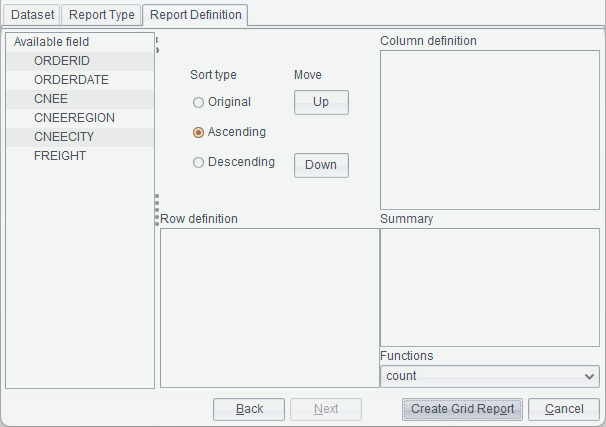
On this interface, we define row header, column header and slash-separated cell value for the new crosstab report.
First, let’ define row header of the crosstab report.
On the above interface, select a field by which the row header is grouped from the “Available field” box, where fields are arranged in a tree structure, and drag it to “Row definition” box. To group rows by CNEEREGION for instance, we drag CNEEREGION field to “Row definition” box and the field will be displayed under “Row definition” (in ascending order). If you want the descending order, select “Descending” option under “Sort type”.
Then we define the crosstab report’s column header in the same way. To group by CNEE field, drag this field to “Column definition” box.
Last, we define the cross item of the crosstab report. If we want to calculate the total freight, drag FREIGHT field to “Summary” box and select sum function in the drop-down list of “Functions” to perform SUM on FREIGHT field.
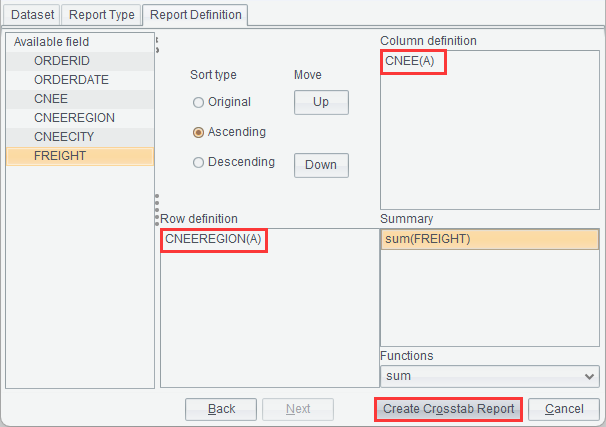
Click “Create Crosstab Report” button to get into the crosstab report editing interface, where report expressions are already automatically generated.
New Report Group
This item leads you through creating a new report group. A report group combines closely connected reports into a unit, and users can work on or process all reports at once as they handle a single report.
Click File -> New Report Group and the following “Report source editor” interface pops up:
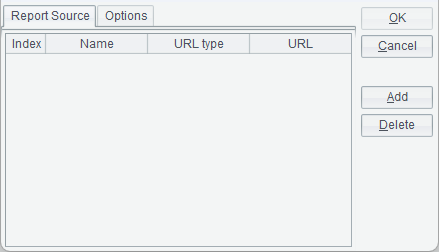
First, add a report source for the report group. The concept of report source to a report group’s is like that of data set to a report.
Click “Add” button to add a new report source and double-click the “URL” column to choose a report you want to add in the pop-up “Open” window. There are two types of URL – relative path and absolute path; a relative path is relative to the resource directory configured in Tools -> Options -> File. Note: Do not precede a relative path with the slash “/”.
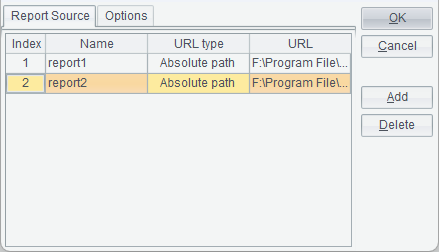
For example, we add absolute paths of Orders table and Orderdetails table, as shown below:
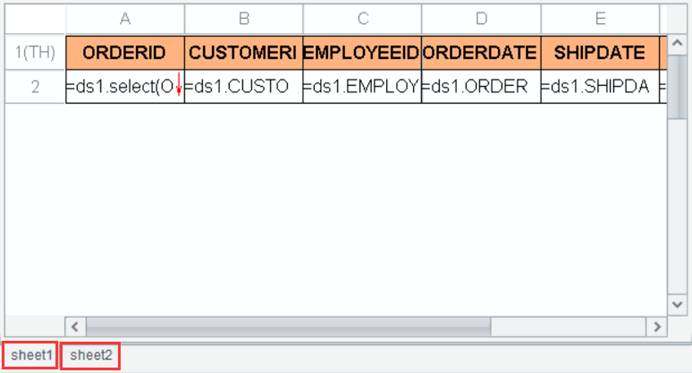
Click “OK” and Excel-like sheet tags appear on the designer interface. Click them and you can view reports in the report group, as shown below:
Open
The Open item is for opening an existing report file (*.rptx), template file (*.rptm), report preview result file (*.rptr) or report group file (*.rptg), or for opening an existing Excel file (*.xls / *.xlsx), editing it and saving it as a report file (*.rptx).
Click
File
-> Open or click ![]() icon on the toolbar or
press Ctrl+O
to pop up the Open dialog:
icon on the toolbar or
press Ctrl+O
to pop up the Open dialog:
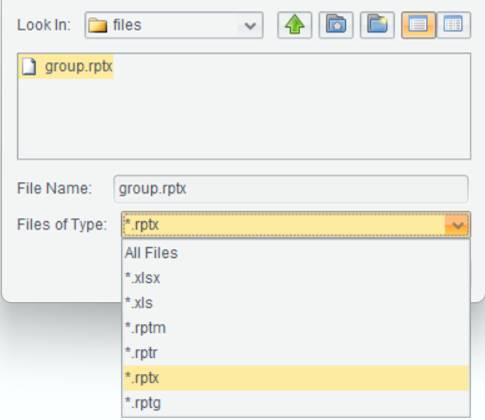
Select a file type, find the target file and click Open button to open the file on the designer. When trying to open an Excel file, you only get its first sheet and a pop-up box at the same time, as the following shows:
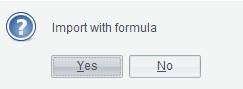
Click Yes to import formulas and No to only import values without formulas.
Quick Open
You can open an existing report file using an URL or a file path through this menu item.
Click File -> Quick Open or press Ctrl+Q to pop up the interface below:
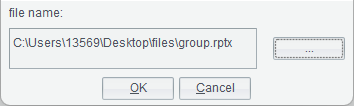
In this editor, you can edit the path for opening a report file, and then click “OK” button to open the target file.
Close
By clicking this menu item, you can close the current file on the report designer.
Click File
-> Close or click ![]() icon at the top right corner, or press Ctrl+W
or Ctrl+F4
to close the current file on the report designer.
icon at the top right corner, or press Ctrl+W
or Ctrl+F4
to close the current file on the report designer.
Close all
By clicking this menu item, you can close all files opened on the report designer.
Click File -> Close all to close all files opened on the report designer.
Save
You can save a newly created or modified report file or report group file through this menu item.
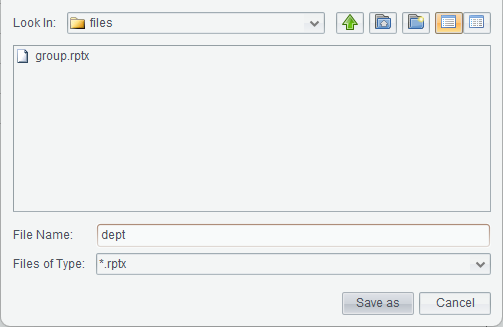
For a newly created
report, click File -> Save, or click ![]() icon on the toolbar, or press Ctrl+S
to pop up “Save As” dialog, where you select a location where the report will
be saved, and edit the report file name. Then click “Save As” button to save
the report, as shown below:
icon on the toolbar, or press Ctrl+S
to pop up “Save As” dialog, where you select a location where the report will
be saved, and edit the report file name. Then click “Save As” button to save
the report, as shown below:
For a modified
report, click File -> Save, or click ![]() icon on the toolbar, or press Ctrl+S
to save the modification.
icon on the toolbar, or press Ctrl+S
to save the modification.
Save As
This menu item lets you save the current report file or report group file in a different name or location, or save the report preview result file.
Click File -> Save As and in the pop-up “Save As” dialog, select a location for saving the current file and edit the file name. Then click “Save As” button to save file.
Preview
This menu item lets you preview the data presentation effect of a report.
Click
File
-> Preview, or click ![]() icon, or press F9 to
preview the effect of a finished report.
icon, or press F9 to
preview the effect of a finished report.
Export
Through this series of menu items, you can export certain report data to Excel, Word, PDF, Text, XML and HTML, and then perform operations on the result file.
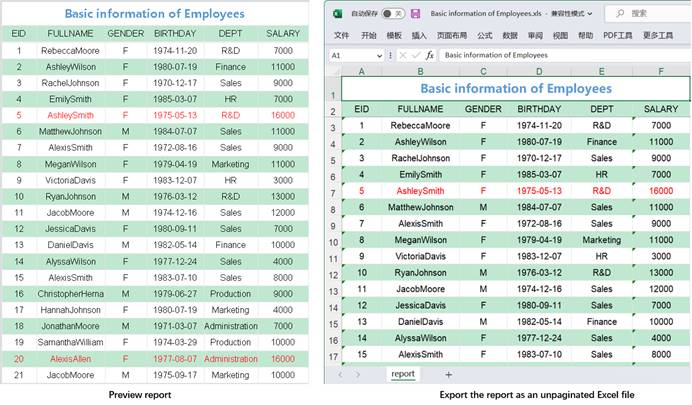
Export a report as an unpaginated Excel file.
Under the preview status, click File -> Export -> Excel file to get into the “Open” dialog, where you select a location for saving the target Excel file and enter a file name, as figure 1.2.10.1-1 shows:
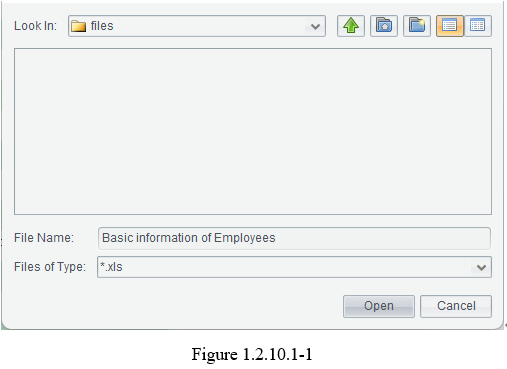
Click “Open” button to export information of the report under preview to an unpaginated Excel file. By exporting a report displaying employee information to an Excel file, the export effect is as follows:
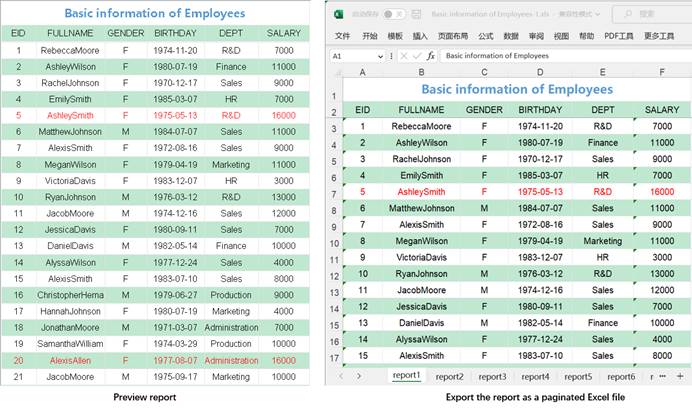
Paginated Excel
This menu item lets you export a report to a paginated Excel file.
Under the preview status, click File -> Export -> Paginated Excel to get into the “Open” dialog, where you select a location for saving the target Excel file and enter a file name. As figure 1.2.10.1-1 shows, click “Open” button to export information of the report under preview to a paginated Excel file.
By exporting a report displaying employee information to a paginated Excel file, the export effect is as follows:
Excel with Formula
This menu item lets you export a report to an Excel file with formulas.
Under the preview status, click File -> Export -> Excel with Formula to get into the “Open” dialog, where you select a location for saving the target Excel file and enter a file name. As figure 1.2.10.1-1 shows, click “Open” button to export information of the report under preview to an Excel file with formulas.
●Under this menu item, formulas that Excel does not support cannot be exported and paginatation isn’t supported.
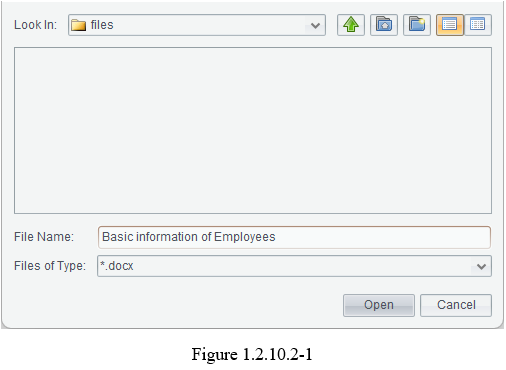
This menu item lets you export a report to a Word file.
Under the preview status, click File -> Export -> Word file to get into the “Open” dialog, where you select a location for saving the target Word file and enter a file name and its extension. As figure 1.2.10.2-1 shows, click “Open” button to export information of the report under preview to a Word file.
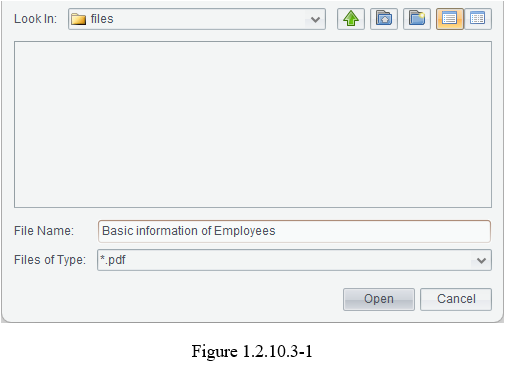
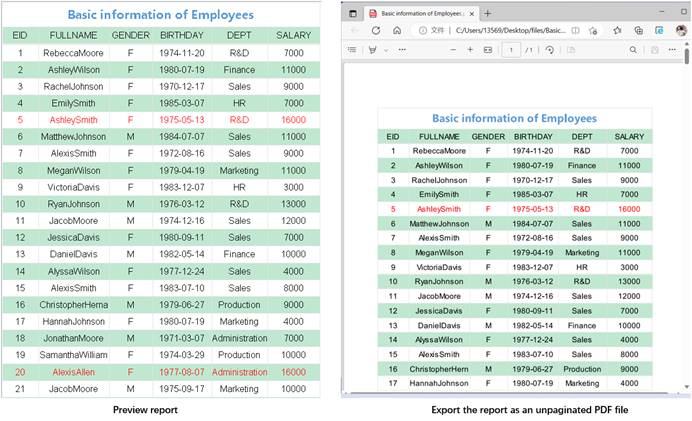
This menu item lets you export a report to an unpaginated PDF file.
Under the preview status, click File -> Export -> PDF file to get into the “Open” dialog, where you select a location for saving the target PDF file and enter a file name. As figure 1.2.10.3-1 shows, click “Open” button to export information of the report under preview to a PDF file.
By exporting a report displaying employee information to an unpaginated PDF file, the export effect is as follows:
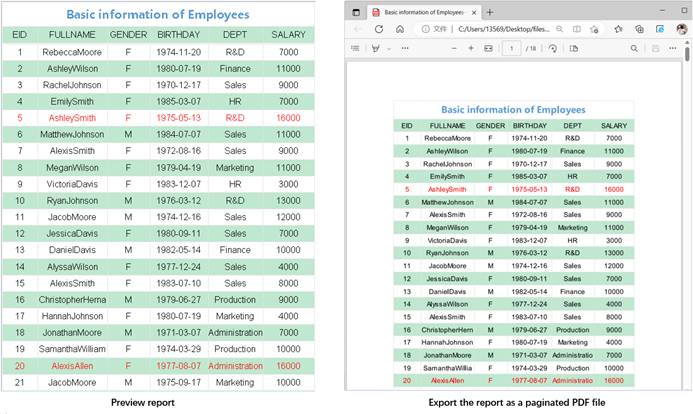
Paginated PDF
This menu item lets you export a report to a paginated PDF file.
Under the preview status, click File -> Export -> Paginated PDF to get into the “Open” dialog, where you select a location for saving the target PDF file and enter a file name. As figure 1.2.10.3-1 shows, click “Open” button to export information of the report under preview to a paginated PDF file.
By exporting a report displaying employee information to a paginated PDF file, the export effect is as follows:
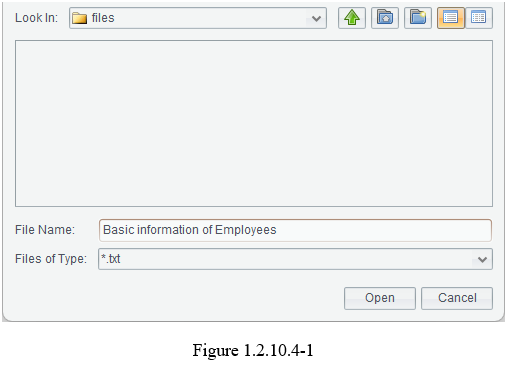
This menu item lets you export a report to a text file.
Under the preview status, click File -> Export -> Text file to get into the “Open” dialog, where you select a location for saving the target text file and enter a file name. As figure 1.2.10.4-1 shows:
Click “Open” button to pop up the following “Export-to-text Options” dialog:
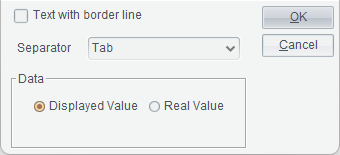
If you want to export a text file showing gridlines in the background, check “Text with border line” option. By doing this, the “Separator” drop-down list and “Data” box turn gray.
For an exported text file without showing gridlines, select in the “Separator” drop-down list the separator for separating cells in the report file, and the exported text file will use the selected separator. The available separators are “Tab”, “Comma”, “Semicolon”, Hash” and “Asterisk”. In “Data” box, select whether you want to show “Displayed Value” or “Real Value” for the exported data. Then click “OK” button to export information of the report under preview to a text file format.
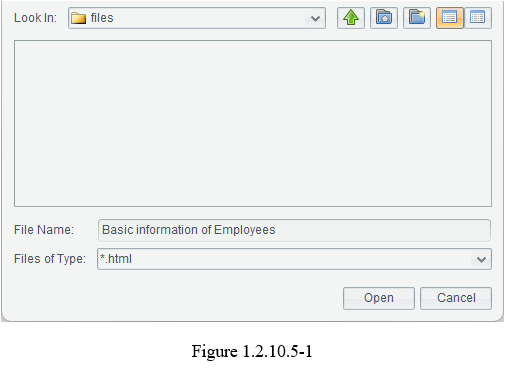
This menu item lets you export a report as an .html file format.
Under the preview status, click File -> Export -> HTML file to get into the “Open” dialog, where you select a location for saving the target HTML file and enter a file name. As figure 1.2.10.5-1 shows, click “Open” button to export information of the report under preview to an HTML file.
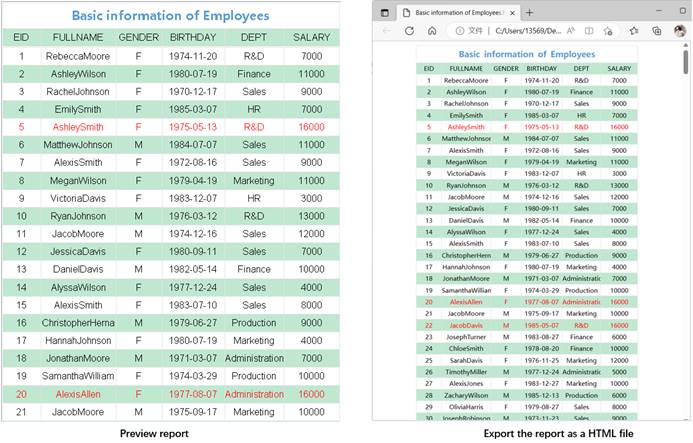
By exporting a report displaying employee information to an HTML file, the export effect is as follows:
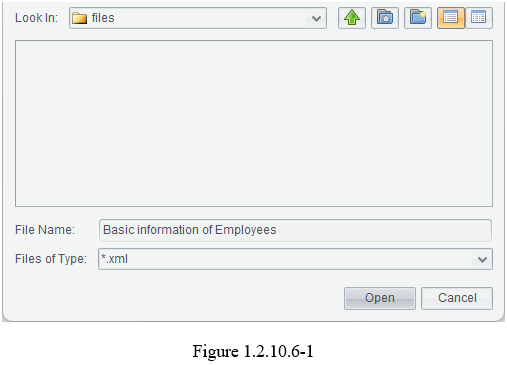
This menu item lets you export a report as an XML file.
Under the preview status, click File -> Export -> XML file to get into the “Open” dialog, where you select a location for saving the target XML file and enter a file name. As figure 1.2.10.6-1 shows, click “Open” button to export information of the report under preview to an XML file.
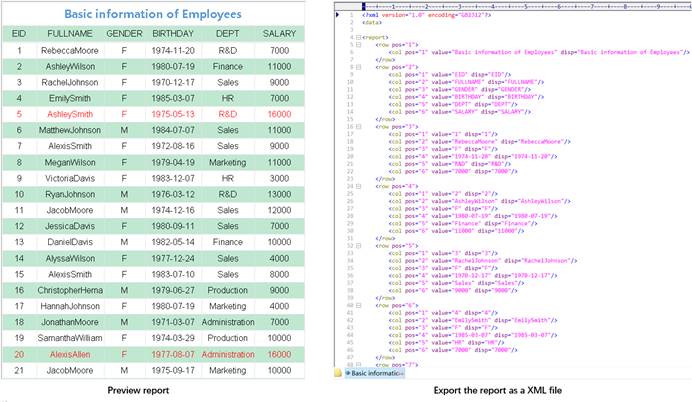
By exporting a report displaying employee information to an XML file, the export effect is as follows:
Office2007
Items on this menu are used to export reports as office2007 Excel file format. Refer related details in Excel file, Paginated Excel and Excel with Formula items.
Template
This series of menu items helps store reports having certain same qualities as built-in templates. We can create new reports based on these built-in templates. This can greatly reduce workload of repeatedly making reports. By default, there isn’t the “Template” item under File menu on the designer.
Click Tools -> Options -> General, check “Template menu” option and click “OK” button. Then restart designer and you can find “Template” on File menu.
Save as template
Through this item we can add the currently edited report file to the template library, where a template file’s extension is .rptm. Later we can create new reports based on the existing templates.
Open a finished report file (.rptx) and click File -> Template -> Save as template to get the interface below:
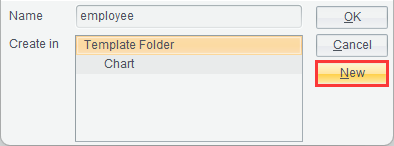
Select a folder in the tree-structure “Create in” box and click “New” button on the right to create a subfolder under the selected folder.
Select a folder in the tree-structure “Create in” box, enter a template name in “Name” edit box and click “OK” button to save the newly-created template file (.rptm) in the selected folder.
Sort Template
You can sort out template files and name relative folders and files through this item.
Click File-> Template -> Sort Template to open the folder holding template files and sort out them.
Create Reports Using Templates
This item lets you create a new report using an existing template.
Click File -> Template and select a desired template and open it. Then you can make a report based on this template and save the finished report as a .rptx file.
Recent Files
By clicking this item, we can check report files recently opened.
Click File -> Recent Files and then a desired report file to directly open it. If your target report is recently opened, just open it through “Recent Files” without accessing it through File -> Open.
Recent Connections
Through this item, you can check the recently connected data sources.
Click File-> Recent Connections and select the desired data source to connect it. If your target data source is recently connected, just connect it through “Recent Connections” without connecting it through Tools -> Datasource.
Exit
You can close the report designer through the “Exit” item.
Click File
-> Exit, or click ![]() icon at the top right conner on the
designer to close the report designer.
icon at the top right conner on the
designer to close the report designer.