Web Integration and Hyperlink
You can choose to skip this section if you are not a professional programmer. This won’t affect your learning about the other contents of this Tutorial.
In The Basics and Coordinate Systems and Transformation, as well as other chart element documents, we discussed the method of plotting charts in esProc. To display charts on the web, however, hyperlinks are often required. Here let’s see how to design hyperlinks and how to use them when plotting charts with esProc.
12.10.1 Displaying charts on web
The esProc G.draw() function returns a plotted chart as a byte array that is used to generate the image on the web page.
A simple plotting algorithm (ChartGYM.splx) for a column chart showing results of athletes:
|
|
A |
|
1 |
=canvas() |
|
2 |
=demo.query("select * from GYMSCORE where NAME=?",name) |
|
3 |
=A1.plot("BackGround") |
|
4 |
=A1.plot("EnumAxis","name":"x","xEnd":0.9,"xPosition":0.7) |
|
5 |
=A1.plot("NumericAxis","name":"y","location":2,"yStart":0.7) |
|
6 |
=A1.plot("Column","axis1":"x","data1":A2.(EVENT),"axis2":"y", "data2":A2.(SCORE)) |
|
7 |
=A1.plot("Text","text":name,"textFont":"Arial","textStyle":3,"textSize":16,"textColor":-10092340,"data1":0.5,"data2":-30) |
|
8 |
return A1.draw@p(450,200) |
This is similar to the plotting algorithm used in The Column Element, from which more information can be learned. Here name is a cellset parameter for specifying the athlete name:
The plotted chart needs to be returned through the return function to be invoked by a web application.
The plotting algorithm doesn’t involve a hyperlink. The hyperlink properties will be covered in the next section. Now to display the chart plotted by the algorithm on the web, follow these deploying instructions:
1) Deploy testChart application in apache-tomcat-6.0.43.
<Context path="/testChart" docBase="D:\tools\apache-tomcat-6.0.43\testChart" debug="0" privileged="true">
</Context>
2) Under the application directory testChart, place jars that esProc requires, including basic jars and the hsql driver hsqldb-2.2.8.jar, as well as the required configuration file raqsoftConfig.xml. See Deploying JDBC for more details.
3) Prepare a class com.SaveChart to store the image data during running the program, using the following code:
package com;
import java.util.HashMap;
public class SaveChart {
private static HashMap<String, byte[]> chartMap = new HashMap();
public static void addChart(String id, byte[] bytes) {
chartMap.put(id, bytes);
}
public static byte[] getChart(String id) {
return chartMap.get(id);
}
public static void clear() {
chartMap.clear();
}
}
The class uses the static method addChart to store an array of bytes of the image, and getChart to retrieve the data. After the code is compiled, deploy the class in the WEB-INF/classes/com path under the application directory.
4) Under the application directory, prepare a readChart.jsp file to read in the specified PNG image from the SavaChart class:
<%@page contentType="text/html; charset=iso-8859-1" language="java" import="com.SaveChart, java.io.*" errorPage=""%>
<!DOCTYPE html>
<%
String chartID = request.getParameter("id");
byte[] image = SaveChart.getChart(chartID);
try {
response.setContentType("image/png");
OutputStream os = response.getOutputStream();
os.write(image);
os.close();
}
catch (Exception e) {
}
%>
In the readChart.jsp file, pass the serial number of the specified image through the parameter id.
5) In the application directory, prepare testChart.jsp file for computing the specified script file, store the resulting byte array of the image in SaveChart and call readChart.jsp to display the image:
<%@page contentType="text/html; charset=iso-8859-1" language="java" import="java.sql.*, com.SaveChart" errorPage=""%>
<!DOCTYPE html>
<%
String spl = request.getParameter("spl");
String arg = request.getParameter("arg");
Connection con = null;
java.sql.PreparedStatement st;
String chartID = "testChart";
try {
Class.forName("com.esproc.jdbc.InternalDriver");
con= DriverManager.getConnection("jdbc:esproc:local://");
String callSpl = spl;
// Allow one parameter that can be called using the method of call spl(arg)
if (arg != null) {
callSpl += "(\""+arg+"\")";
}
else {
callSpl += "()";
}
st =con.prepareCall("call "+callSpl);
st.execute();
ResultSet rs = st.getResultSet();
rs.next();
byte[] image = (byte[]) rs.getObject(1);
SaveChart.addChart(chartID, image);
}
catch (Exception e) {
}
finally {
if (con != null) {
try {
con.close();
}
catch (Exception e) {
e.printStackTrace();
}
}
}
%>
<html>
<head>
<meta http-equiv="Content-Type" content="text/html; charset=gb2312">
<title>testChart</title>
</head>
<body>
<img src="readChart.jsp?id=<%=chartID%>">
</body>
</html>
In testChart.jsp, pass the serial number of the specified image through the parameter spl; and a parameter arg is allowed to be set. See Java Invocation for information about calling a script file to perform related computations.
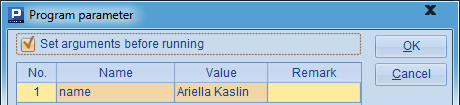
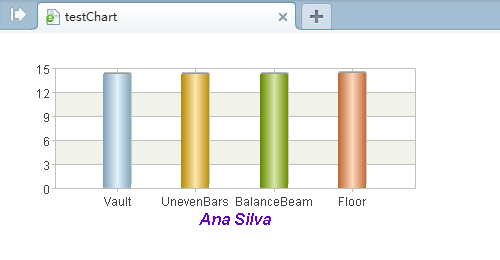
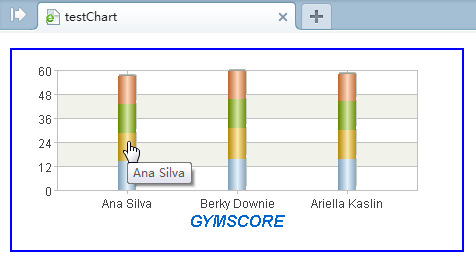
Launch Tomcat to display the chart plotted using the plotting algorithm above. Enter the URL - http://localhost:8080/testChart/testChart.jsp?spl=ChartGYM&arg=Ana Silva - into the web browser and you’ll see the following result:
12.10.2 Hyperlink properties
The plotting algorithm in the previous section plots a chart showing scores of one athlete. With the hyperlink, you can view the athlete’s result from a column chart presenting scores of all athletes, whose plotting algorithm (ChartGYMMain.splx) is as follows:
|
|
A |
|
1 |
=canvas() |
|
2 |
=demo.query("select * from GYMSCORE") |
|
3 |
=A1.plot("BackGround") |
|
4 |
=A1.plot("EnumAxis","name":"x","xEnd":0.9,"xPosition":0.7) |
|
5 |
=A1.plot("NumericAxis","name":"y","location":2,"yStart":0.7) |
|
6 |
=A1.plot("Column","stackType":2,"htmlLink":A2.("testChart.jsp?spl=ChartGYM&arg="+NAME),"tipTitle":A2.(NAME),"linkTarget":"_self","axis1":"x","data1":A2.(NAME+","+EVENT),"axis2":"y","data2":A2.(SCORE)) |
|
7 |
=A1.plot("Text","text":"GYMSCORE","textFont":"Arial","textStyle":3,"textSize":16,"textColor":-16750900,"data1":0.5,"data2":-30) |
|
8 |
return A1.draw@p(450,200),A1.hlink() |
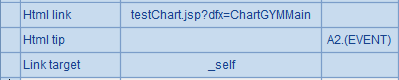
Here A2 gets data of all athletes’ results for plotting a stacked column chart. A6 specifically specifies hyperlink properties when plotting the column element:
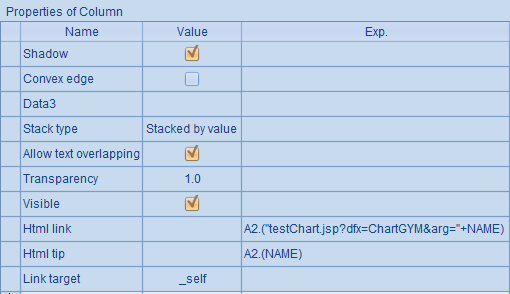
The hyperlink Html link points to testChart.jsp, where spl is defined as the plotting algorithm ChartGYM for a chart showing results of one athlete, and the parameter arg is specified as this athlete’s name. Screen tip is set to get the athlete name, and Link target is modified from the default new window _blank to the current window _self. The Link target can also be set as other values according to HTML syntax, such as _parent, _top, and so on.
Note that the result of using a hyperlink should be returned as a string with G.hlink(). So A8 returns two results: one is the image byte array, the other is the hyperlink to the image.
To return from a chart for a certain athlete to the original main chart, modify the plotting algorithm ChartGYM.splx in the previous section:
|
6 |
=A1.plot("Column","htmlLink":"testChart.jsp?spl=ChartGYMMain","tipTitle": A2.(EVENT),"linkTarget":"_self","axis1":"x","data1":A2.(EVENT),"axis2":"y", "data2":A2.(SCORE)) |
|
7 |
=A1.plot("Text","text":"GYMSCORE","textFont":"Arial","textStyle":3,"textSize":16,"textColor":-16750900,"data1":0.5,"data2":-30) |
|
8 |
return A1.draw@p(450,200),A1.hlink() |
Add the hyperlink properties to the column element and modify A8’s return statement to return both the byte array of the image and the hyperlink. Below shows hyperlink properties for the column element specified by A6:
Since two results would be returned from the script file after a hyperlink is defined, readChart.jsp needs to be modified too to handle the returned hyperlink:
<%@page contentType="text/html; charset=gb2312" language="java" import="java.sql.*,
java.io.*,java.util.*,com.SaveChart" errorPage=""%>
<!DOCTYPE HTML PUBLIC "-//W3C//DTD HTML 4.01 Transitional//EN">
<%
String spl = request.getParameter("spl");
String arg = request.getParameter("arg");
Connection con = null;
java.sql.PreparedStatement st;
String chartID = "testChart";
String links = "";
try {
Class.forName("com.esproc.jdbc.InternalDriver");
con= DriverManager.getConnection("jdbc:esproc:local://");
String callSpl =spl;
if (arg != null) {
callSpl += "(\""+arg+"\")";
}
else {
callSpl += "()";
}
st =con.prepareCall("call "+callSpl);
st.execute();
ResultSet rs = st.getResultSet();
rs.next();
byte[] image = (byte[]) rs.getObject(1);
SaveChart.addChart(chartID, image);
// Move on next to handle the hyperlink result
st.getMoreResults();
rs = st.getResultSet();
rs.next();
links = (String) rs.getObject(1);
}
catch (Exception e) {
}
finally {
if (con != null) {
try {
con.close();
}
catch (Exception e) {
e.printStackTrace();
}
}
}
%>
<html>
<head>
<meta http-equiv="Content-Type" content="text/html; charset=gb2312">
<title>testChart</title>
</head>
<body>
<img src="readChart.jsp?id=<%=chartID%>" usemap="#<%=chartID%>map">
<map id="<%=chartID%>map"><%=links%>
</map>
</body>
</html>
In the above code, after the byte array of the image is obtained, add the map property for using the image to the hyperlink information with HTML code to make the hyperlink work.
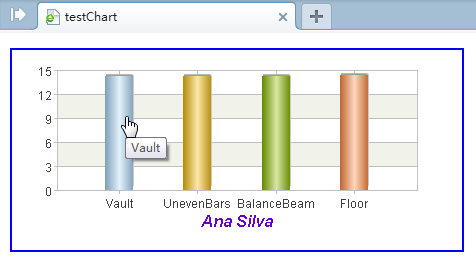
Then, if entering the URL http://localhost:8080/testChart/testChart.jsp?spl=ChartGYMMain in the web browser, you would get the following result:
At this point the hyperlink added to the column chart has taken effect. Hover the mouse over a column and a specified tip will appear. Then click on the tip to jump to the chart for a specified athlete:
12.10.3 Using SVG
You can choose to output an SVG vector image for a chart plotted with esProc. There are some differences, however, between an SVG image and a png, jpg or gif image.
The first is the plotting algorithm. Below is a plotting algorithm (ChartSVG.splx) of a column chart showing an athlete’s scores.
|
|
A |
|
1 |
=canvas() |
|
2 |
=demo.query("select * from GYMSCORE where NAME=?",name) |
|
3 |
=A1.plot("BackGround") |
|
4 |
=A1.plot("EnumAxis","name":"x","xEnd":0.9,"xPosition":0.7) |
|
5 |
=A1.plot("NumericAxis","name":"y","location":2,"yStart":0.7) |
|
6 |
=A1.plot("Column","htmlLink":"testChartSVG.jsp?spl=ChartSVGMain","linkTarget":"_self","axis1":"x","data1":A2.(EVENT),"axis2":"y","data2":A2.(SCORE)) |
|
7 |
=A1.plot("Text","text":name,"textFont":"Arial","textStyle":3,"textSize":16,"textColor":-10092340,"data1":0.5,"data2":-30) |
|
8 |
return A1.draw(550,200) |
This plotting algorithm and the one in the first section use the same parameter: name. Main differences are that G.draw() in A8 doesn’t use any option and that no G.hlink() is used to return the hyperlink data. Instead, a hyperlink is defined with testChartSVG.jsp. Related code will be explained later. In this case the column chart displaying scores for all athletes can be plotted using the following plotting algorithm ChartSVGMain.splx:
|
|
A |
|
1 |
=canvas() |
|
2 |
=demo.query("select * from GYMSCORE") |
|
3 |
=A1.plot("BackGround") |
|
4 |
=A1.plot("EnumAxis","name":"x","xEnd":0.9,"xPosition":0.7) |
|
5 |
=A1.plot("NumericAxis","name":"y","location":2,"yStart":0.7) |
|
6 |
=A1.plot("Column","stackType":2,"htmlLink": A2.("testChartSVG.jsp?spl=ChartSVG&arg="+NAME),"linkTarget":"_self", "axis1":"x","data1":A2.(NAME+","+EVENT),"axis2":"y","data2":A2.(SCORE)) |
|
7 |
=A1.plot("Text","text":"GYMSCORE","textFont":"Arial","textStyle":3,"textSize":16,"textColor":-16750900,"data1":0.5,"data2":-30) |
|
8 |
return A1.draw(550,200) |
Likewise, the plotting algorithm returns an SVG image with a hyperlink using testChartSVG.jsp.
Below is the code for testChartSVG.jsp:
<%@page contentType="text/html; charset=gb2312" language="java" import="java.sql.*" errorPage=""%>
<!DOCTYPE html>
<%
Stringspl = request.getParameter("spl");
String arg = request.getParameter("arg");
Connection con = null;
java.sql.PreparedStatement st;
String svg = "";
try {
Class.forName("com.esproc.jdbc.InternalDriver");
con= DriverManager.getConnection("jdbc:esproc:local://");
String callSpl =spl;
if (arg != null) {
callSpl += "(\""+arg+"\")";
}
else {
callSpl += "()";
}
st =con.prepareCall("call "+callSpl);
st.execute();
ResultSet rs = st.getResultSet();
rs.next();
Object o = rs.getObject(1);
byte[] bytes = (byte[]) rs.getObject(1);
svg = new String(bytes, "UTF-8");
}
catch (Exception e) {
}
finally {
if (con != null) {
try {
con.close();
}
catch (Exception e) {
e.printStackTrace();
}
}
}
%>
<html>
<head>
<meta http-equiv="Content-Type" content="text/html; charset=gb2312">
<title>testSVG</title>
</head>
<body>
<%=svg%>
</body>
</html>
Compared with the testChart.jsp in the first section, it is not necessary here to use readChart.jsp to handle the returned image. Instead, the SVG image code is generated right through the returned byte array and can be used directly in HTML.
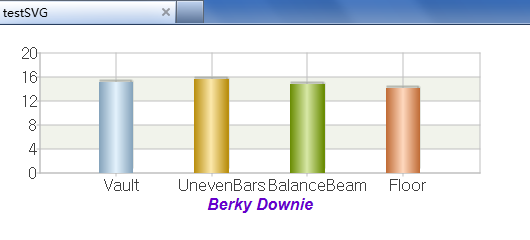
The SVG code is allowed to include the hyperlink information, so there is no need to use the method introduced in the second section to enable the hyperlink. But note that SVG code is available only with web browsers supporting HTML5.0, such as IE9 version or above.
By accessing the website http://localhost:8080/testChart/testChartSVG.jsp?spl=ChartSVGMain through web browser, you’ll get the following result:
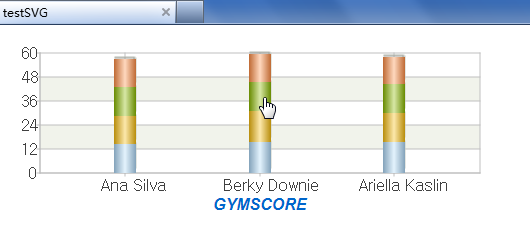
Click on a column and the hyperlink will jump to the chart you desire: