Grouping and Summarizing Data
It is a common task to group records in a table sequence as needed and to summarize the data in each group during statistics and data analysis. This includes data aggregation tasks like calculating sum and average, as well as listing top n records, and etc. This part explores how to group and summarize the data of a table sequence in esProc.
3.2.1 Finding distinct values
Of fields of all the records, there are some containing values that are different from each other, such as ordinal numbers, but lots of them could have duplicate values. Sometimes all the different values are required to be listed, and, in this case, id function will be used. For example:
|
|
A |
|
1 |
=file("Order_Books.txt").import@t() |
|
2 |
=A1.id(SalesID) |
|
3 |
=A1.id(PName) |
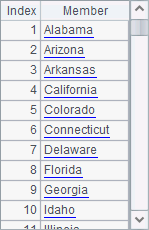
Below is a selection of A1’s table sequence:
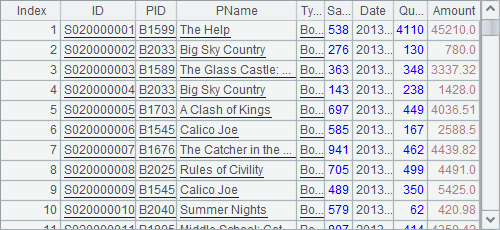
A2 gets all the distinct IDs of salespersons, i.e. SalesID. A3 gets all the distinct names of books, i.e. PName. Results of A2 and A3 are as follows:
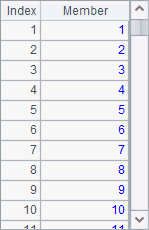
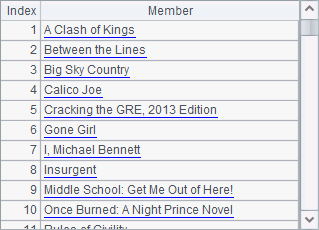
As can be seen from the results, id function will sort values in ascending order when computing distinct values.
Actually, id function returns a result similar to that returned by the SQL distinct statement.
|
|
A |
|
1 |
=demo.query("select * from EMPLOYEE") |
|
2 |
=A1.id(STATE) |
|
3 |
=demo.query("select distinct STATE from EMPLOYEE") |
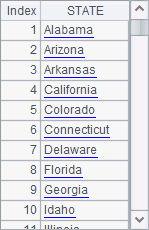
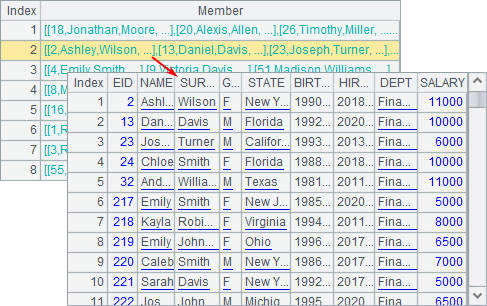
The following is a table sequence of employee information A1 retrieves from the database:
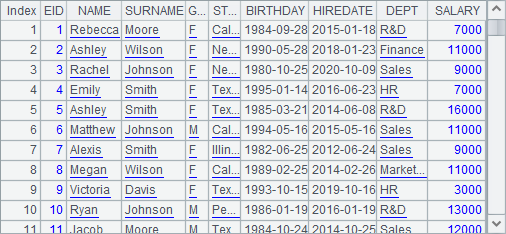
A2 finds out all distinct states from the table sequence in A1 using id function, while A3 gets them from the database using the distinct statement. Results of A2 and A3 are as follows:
The two methods return the same result. The difference is that id function returns the result as a sequence, while the SQL statement returns a result of table sequence from the database.
But sometimes you might want to keep the original order of the data. To achieve this, use @o option. For example:
|
|
A |
|
1 |
=demo.query("select * from EMPLOYEE") |
|
2 |
=A1.id@o(STATE) |
Now A2’s result is this:
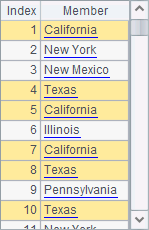
The id@o function doesn’t sort data but directly removes the neighboring data of the same value. So, there could be duplicate values in the result, like Texas and California in the above result.
If there is only one specified field in id() function and the field contains natural numbers, the function can use @n option or @b option to speed up comparisons.
id function can list all distinct results of a certain expression rather than all distinct values of a field:
|
|
A |
|
1 |
=demo.query("select * from EMPLOYEE") |
|
2 |
=A1.id@u(age(BIRTHDAY)) |
A2 lists the ages of employees with @u option. This will remove duplicate values form the result set and sort values in the order of their appearances:
3.2.2 Equi-grouping
You often need to group data according to a certain value, such as grouping employees by department and grouping people by gender. esProc provides group function to group data of a table sequence or a record sequence and return a sequence composed of groups. For example:
|
|
A |
|
1 |
=demo.query("select * from EMPLOYEE") |
|
2 |
=A1.group(DEPT) |
|
3 |
=A1.group@o(DEPT) |
|
4 |
=A1.group(year(BIRTHDAY)) |
A2 groups records of employees by DEPT. The result is as follows:
The result is a sequence whose members are groups sorted by department in alphabetical order. Each group is a record sequence consisting of records of employees in the same department.
The group function can also work with @o option to keep the original order by only putting the neighboring data with the same values into one group, like what A3 does. It only puts the neighboring employees of the same department into one group when grouping data by department. The result is as follows:
You can also group data by a given expression by putting data that make the expression produce the same result into one group. For example, A4 groups employees by the birth year. Here’s the result:
The group function is similar to the group by operation in SQL. Its return value is a sequence consisting of groups. It is a sequence composed of sequences. The grouping result can be used repeatedly for further data grouping and aggregation. This is different from SQL that hasn’t the explicit set data types and, therefore, cannot store the grouping result. With SQL, each group of data must be summarized immediately when group by is executed, and after that the grouping result will be dumped and thus cannot be reused.
esProc allows summarizing the data of each group after data grouping repeatedly and in different ways. For example:
|
|
A |
|
1 |
=demo.query("select * from EMPLOYEE") |
|
2 |
=A1.group(DEPT) |
|
3 |
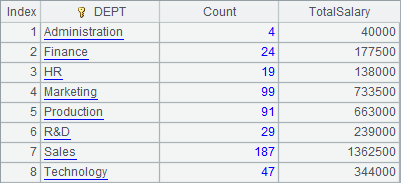
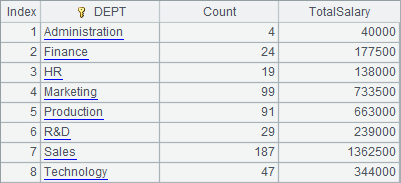
=A2.new(DEPT,count(~):Count,~.sum(SALARY):TotalSalary) |
|
4 |
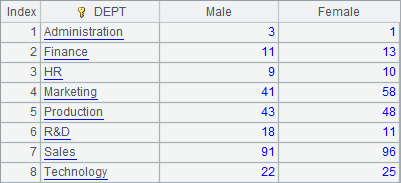
=A2.new(DEPT,~.count(GENDER=="M"):Male, ~.count(GENDER=="F"):Female) |
Using the grouping result, A3 computes the number of employees and the total salary of each department. A4 computes the number of male employees and the number of female employees in each department. Both return the summarizing result as a table sequence, as shown below:
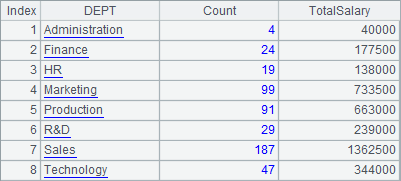
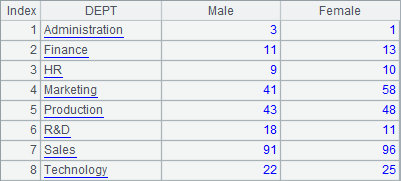
A3 and A4 perform different summarizing operations based on the same grouping result of A2. Reusing the grouping result is one of the important features of esProc.
An explanation of the expression =A2.new(DEPT,count(~):Count,~.sum(SALARY):TotalSalary) in A3: As A2 is the result of grouping A1’s table sequence, every one of its members is a set of records, that is, a record sequence. Therefore, when new function performs loop computation on A2, the targets of its expressions are the record sequences. For example, DEPT means getting the value of DEPT field of the first record of the current record sequence; ~.sum(SALARY) means summing up the SALARY field of the current record sequence.
Similar to the group by clause in SQL, group function also supports grouping data by multiple fields (expressions) simultaneously. In that case, only records in which the values of the specified fields have the same values will be grouped together.
Sometimes you need to divide an amount of data into a specified number of groups, In that case, ntile(i,n) function is useful. For example:
|
|
A |
|
1 |
=ntile(123,40) |
|
2 |
=demo.query("select * from EMPLOYEE") |
|
3 |
=A2.group(ntile(#,60)) |
|
4 |
=A3.new(#:GID,~.count():Count,~:Emps) |
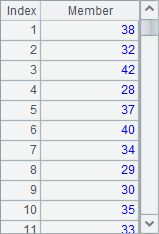
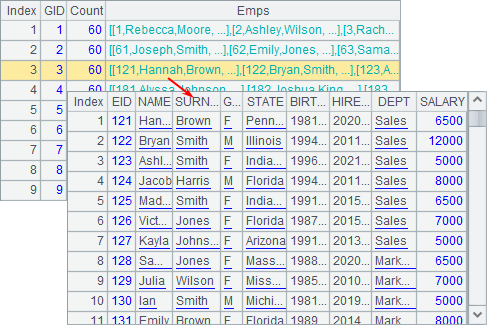
The function finds that if every group contain n members, then which group will the ith member fall in. A1’s expression finds that if every 40 are put into one group, then which group will the 123th member stays. Here’s the result:
![]()
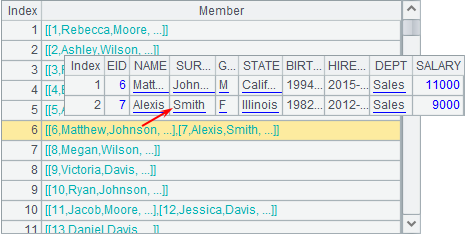
A3 uses ntile() function to group the employees with 60 in each. A4 calculates the number of employees in each group. Here’s A4’s result:
To separate n records evenly into k groups, use ntile(i,k,n) function:
|
|
A |
|
1 |
=demo.query("select * from EMPLOYEE") |
|
2 |
=A1.len() |
|
3 |
=A1.group(ntile(#,6,A2)) |
|
4 |
=A3.new(#:GID,~.count():Count,~:Emps) |
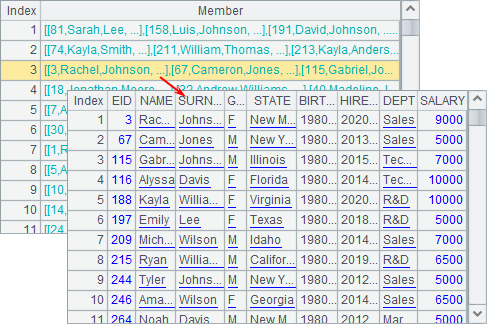
The function finds which group the ith record will fall in. A3 uses the function to separate the employee records into 6 groups evenly. A4 calculates the number of employees in each group. Below is A4’s result:
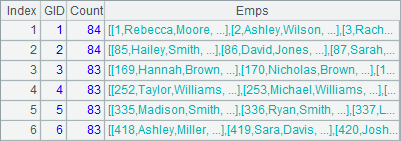
When records can’t be evenly separated, the extra records will be put into groups from to back. The counterpart SQL function is NTILE.
3.2.3 Group and aggregate functions
The previous section illustrates how to group the records in a table sequence and then summarize the records of each group using the grouping result. You can also use the group function to directly get the aggregate result, saving the trouble of computing it step by step. For example:
|
|
A |
|
1 |
=demo.query("select * from EMPLOYEE") |
|
2 |
=A1.group(DEPT;~.count():Count,~.sum(SALARY):TotalSalary) |
|
3 |
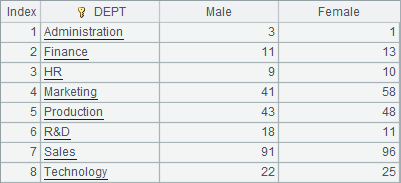
=A1.group(DEPT;~.count(GENDER=="M"):Male, ~.count(GENDER=="F"):Female) |
|
4 |
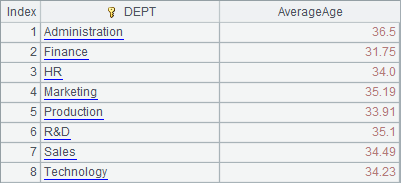
=A1.group(DEPT;round(~.avg(age(BIRTHDAY)),2):AverageAge) |
Both A2 and A3 group and summarize the records by DEPT field directly. They get the same result as that got by step-by-step computation:
A4 computes the average age of employees in each department:
esProc also provides groups function to compute the grouping and summarizing result by accumulation. For example:
|
|
A |
|
1 |
=demo.query("select * from EMPLOYEE") |
|
2 |
=A1.groups(DEPT;count():Count,sum(SALARY):TotalSalary) |
|
3 |
=A1.groups(DEPT;count(GENDER=="M"):Male, count(GENDER=="F"):Female) |
A2 and A3 group and summarize the data by DEPT field simultaneously. Notice that "~." is omitted here. This is different from the code in the above, but the result is the same as that got by grouping first and then summarizing:
The groups function also returns a table sequence when grouping and summarizing data simultaneously. It won’t record the data in each group, but only calculate the accumulated value according to the grouping expression. Compared with the group function, groups function is more efficient.
Note: The groups function can only work with simple aggregate functions, such as sum/count/max/min/top/avg/iterate/icount/median, to perform grouping and aggregation at the same time. To perform complicated grouping and aggregation operations, you should use the group function only.
In particular, top, one of the aggregate functions, can be used to compute the n smallest values. For example:
|
|
A |
|
1 |
=demo.query("select * from EMPLOYEE") |
|
2 |
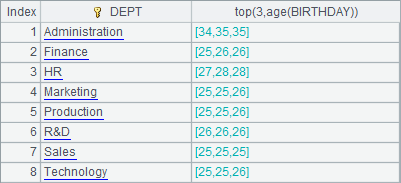
=A1.groups(DEPT;top(3,age(BIRTHDAY))) |
A2 computes the ages of three youngest persons in each department through data grouping:
top can only computes the n smallest values. To find out the ages of three oldest persons are needed, you can use the following method:
|
|
A |
|
1 |
=demo.query("select * from EMPLOYEE") |
|
2 |
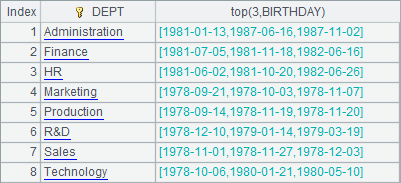
=A1.groups(DEPT;top(3,BIRTHDAY)) |
|
3 |
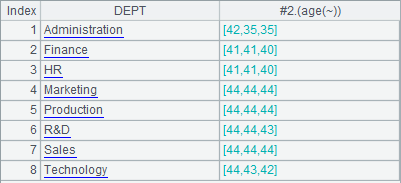
=A2.new(DEPT,#2.(age(~))) |
|
4 |
=A1.groups(DEPT;top(-3,age(BIRTHDAY))) |
A2 first computes the 3 smallest birthdays in each department, and then A3 further computes the corresponding ages. Results of A2 and A3 are as follows:
An alternative method is to add a negative sign before top. For example, A4 gets the 3 smallest ages in terms of negative values, and then A5 computes the corresponding ages. Results of A4 and A5 are as follows: A more convenient method is using top(-n) to directly get the three eldest employees, as A4 does. Here’s the result:
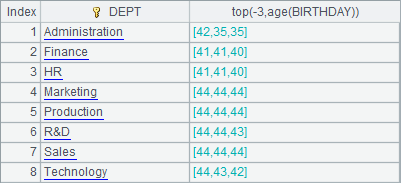
Notice that A3 and A5 get the same results.