Variable configuration
After modeling data is input, you need to configure variables. Now we’ll take train.mtx as an example to illustrate how to perform the configuration.
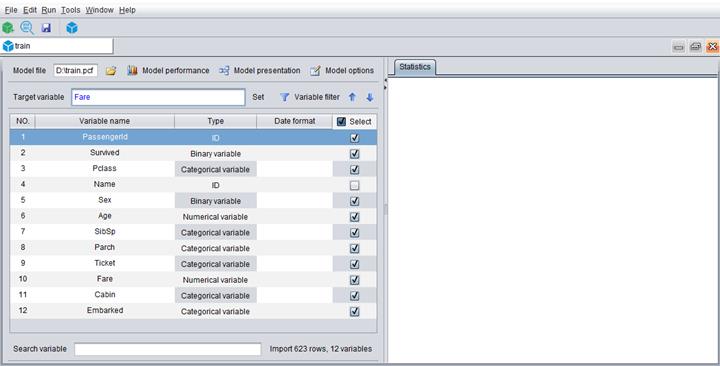
Search variable
There’s “Search variable” on the bottom of the main screen. And the number of loaded lines and variables are listed. To quickly locate a variable, enter it in the box to search for it.
Computed variable
In many cases you can’t build a model directly based on the original variables. You need to calculate them to generate computed variable for the model building.
Click “Edit -> Add computed variable” to configure a computed variable’s name and expression and click “OK” to add it. You can reference an existing function in the expression. Click a function to check its description.
For example, to add a computed variable Sex_b whose value is the first letter of values of variable Sex, the expression should be like this:
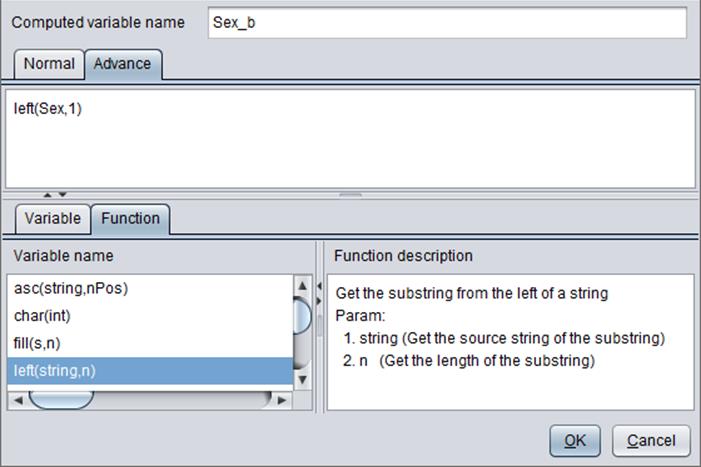
A computed variable is handled as you handle a common variable.
The “Normal” tab provides several variable expression types – “Ratio”, “Time interval”, “Date time combination”, “Interaction”, “Transformation” and “Binning”. Users can quickly define a computed variable according to the directions.
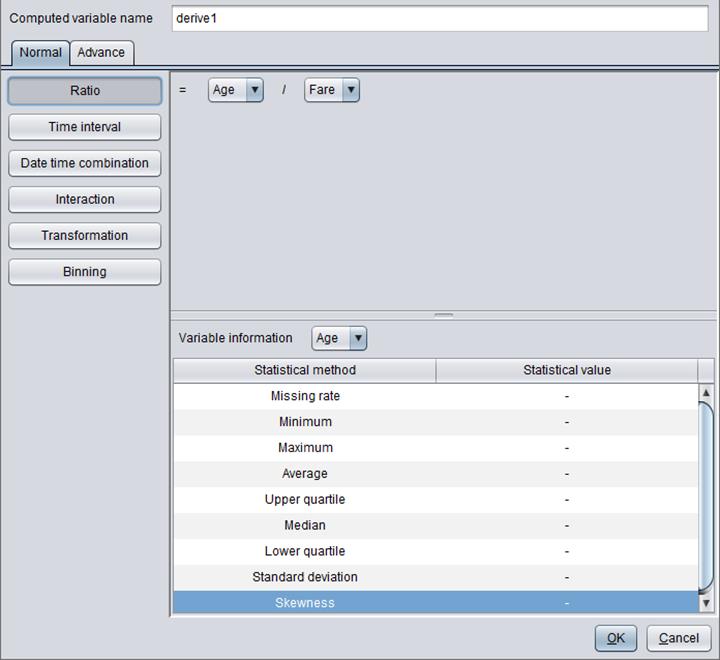
(1) Ratio: ratio
= ![]()
Types of variable x1 and variable x2 are numerical and count. The expression result is a numerical variable.
(2) Time interval: interval = x1-x2
Types of variable x1 and variable x2 are time, date and user-defined time and date. The expression result is a numerical variable.
The unit of time interval can be millisecond, second, minute, hour, day, week, month, quarter and year.
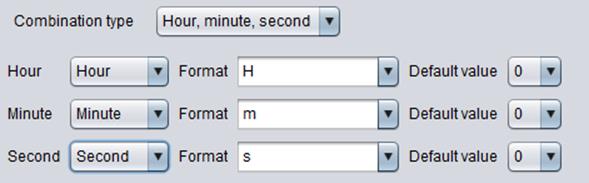
(3) Date time combination: Generate date variable, time variable and datetime variable.

“Combination type” can be:
Year, Month, Day (A date variable)
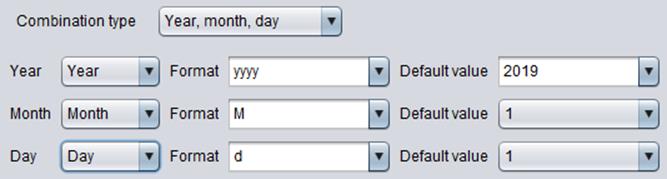
Hour, Minute, Second (A time variable)
Date, Time (A datetime variable)

“Format”: Set data format of a selected field.
Note:
(1)For the “Year,Month,Day” combination, if the format of month data is “MMM”, you need to set “Locale” as “English” when bringing data in.
(2)For the “Date,Time” combination, if date format is defalut then the format of default date value should be consistent with the configured value format. The same with time data. For example, if the date format is “yyyyMMdd”, then the format of default value should be the same as that of the current configuration.
(4) Interaction: You can perform operations over two numerical variables or two categorical variables, but you can’t if one is numerical variable and the other is a categorical variable.
An operation over two
numerical variables: interaction = ![]()
An operation over two
categorical variables: interaction =![]()
For example:
if x1=[0,1,1,1,0,0,1];x2=[0,1,2,3,2,1,1], then
The result is: [(0,0), (1,1), (1,2), (1,3), (0,2), (0,1), (1,1)], which is displayed as a string.
Types of variable x1 and variable x2 are numerical and count. If variable x1 is a numerical or count one, then variable x2 can only be the same one. If variable x1 is a categorical one, then variable x2 can only be the same one, too.
Operations over two numerical variables generate a numerical variable value; Operations over two categorical variables generate a categorical variable value.
(5) Transformation: Functions that are able to perform transformation include logarithm, tangent, arc tangent and hyperbolic tangent. If you calculate logarithm for a number, the base can be e, 2 and 10.
Tangent: tangent = tan(x)
Arc tangent: arc tangent = arctan(x)
Hyperbolic tangent:
hyperbolic tangent = ![]()
Variable x is a numerical one or a count one, and the result is a numerical variable.
(6) Binning
Variable x is a numerical one or a count one, the result can be binary, categorical variable or numerical, which is determined by the specific binning result.
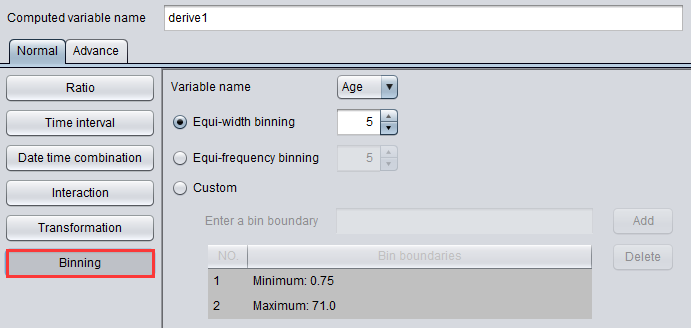
The number of bins resulted from an “Equi-width binning” and an “Equi-frequency binning” is in the range of 2-100.
“Custom”: Enter one number each time in the box after “Enter a bin boundary” between the bin low and the bin high listed below and click “Add” to add bin boundaries.
Analyze variable
We analyze a variable to get information about it. You can choose to analyze one variable or all variables. To make the analysis:
Select a variable and click “Variable analysis” or “Analyze all variables” in the drop-down menu under “Run”.
To analyze all variables:
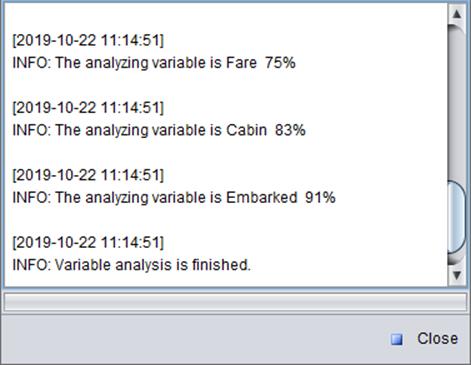
The analysis continues until the message “Variable analysis is finished” appears.
There are 8 variable types for model building – numerical variable, unary variable, binary variable, count variable, categorical variable, ID, time and date, and text string.
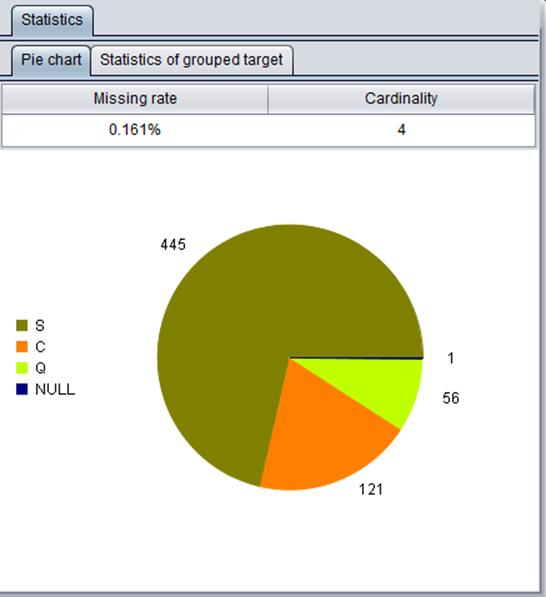
Among them the ID variable and text string variable need not be analyzed. Over a categorical variable, we calculate its missing value rate and association strength and show them with a pie chart. The missing value rate represents the percentage of a variable’s missing records in the total number of records; and the association strength represents the number of unique values in a variable.
For the categorical variable “Embarked”, there are 4 types of values – S, C, Q and missing values. The analysis result is shown below:
The results of analyzing a unary variable and a binary variable are similar. About the strength of association, its value is 1 for a unary variable and 2 for a binary variable.
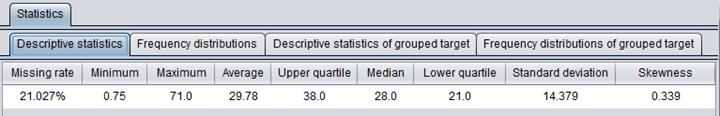
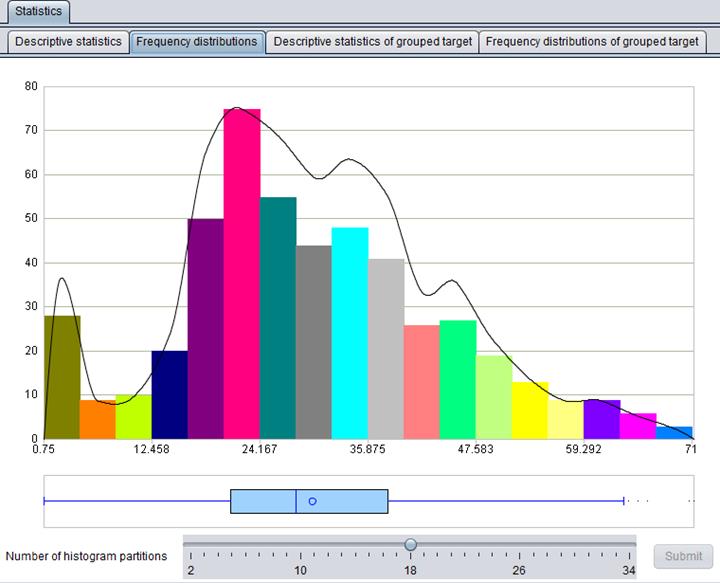
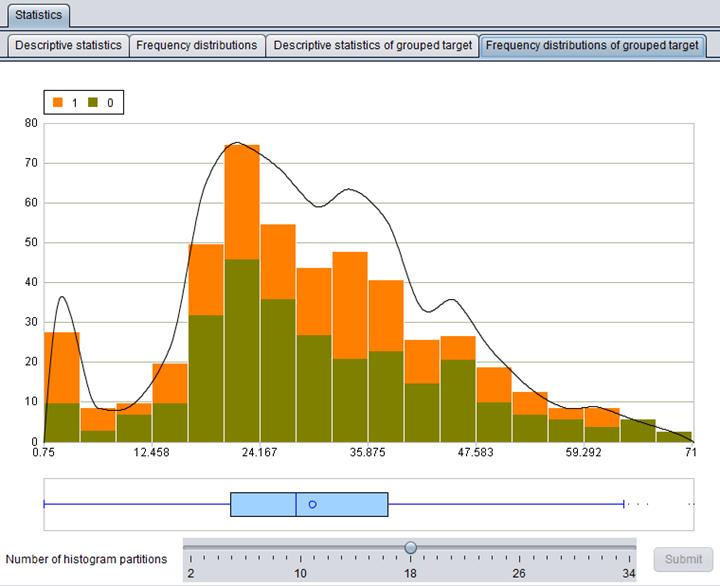
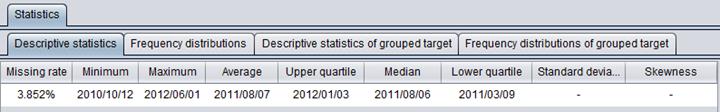
Analyses on count variables and numerical variables are presented through a series of indexes, figures and graphs. There are 4 presentation types – “Descriptive statistics”, “Frequency distributions”, “Descriptive statistics of grouped target”, and “Frequency distributions of grouped target”. Below is an example (statistics of numerical variable Age):
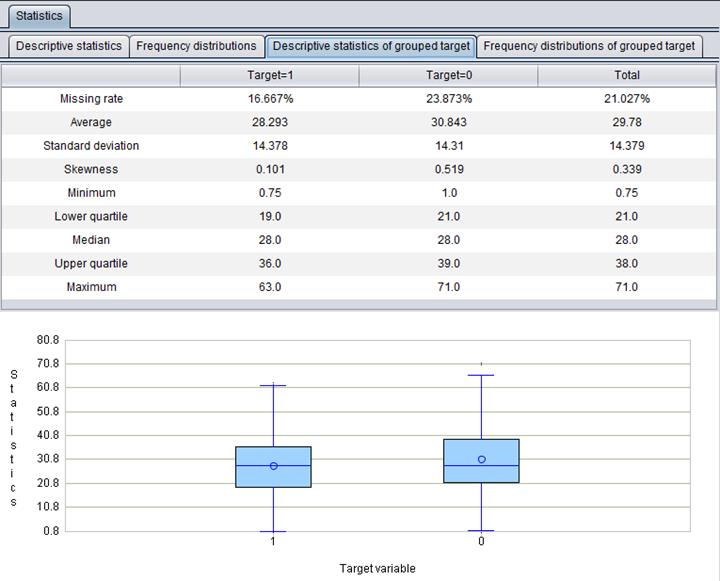
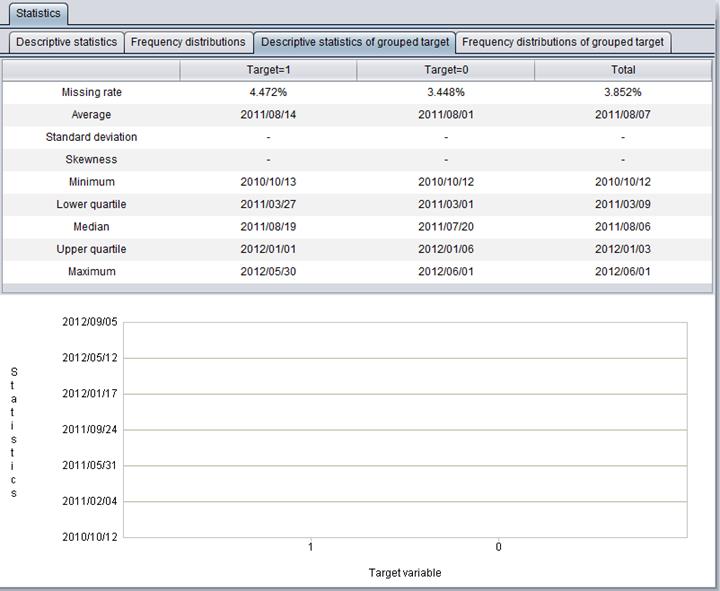
There are same statistical presentation types for date variable. But the most commonly used are “Descriptive statistics” and “Descriptive statistics of grouped target”, as shown below:
Filter variables
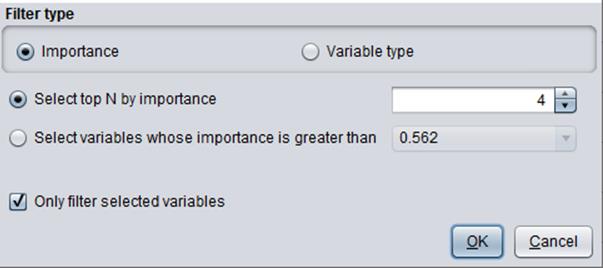
There are two filter ways – By “Importance” and by “Variable type”. Both use the option “Only filter selected variables”. If the option is checked, only filter the selected fields; if unchecked, filter all.
Degree of importance
Degrees of importance of variables will be shown after you execute model building. After that you can filter variables again according to the degrees of importance returned by the newly-created model. The importance degree of ID variable is 0, and that of the target variable won’t be analyzed. You can select top N variables by importance, or select one or more variables whose importance degree is greater than a specified value. The “Importance” option is grey (inactivated) until you execute model building.
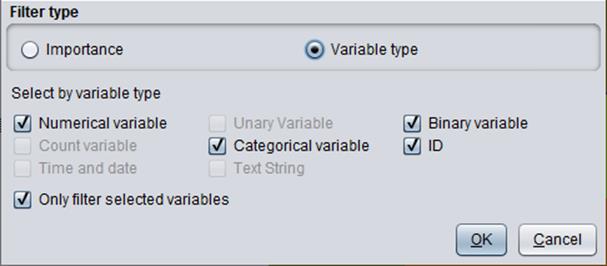
Variable type
To filter variables by variable type is to “Select by variable type”. Types that don’t exist in the loaded data will turn grey.
Target variable
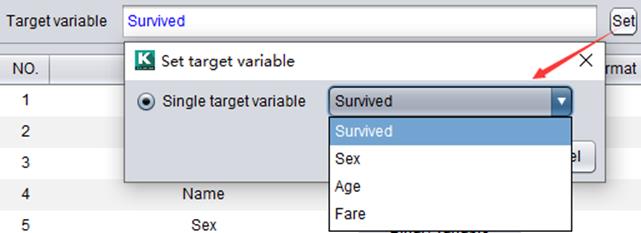
A target variable is a variable to be scored, or the field to be predicted. It is a binary variable or a numerical variable. You can select one among all loaded variables in the drop-down menu under “Target variable” as the target variable.
Take the binary variable “Survived” as an example: